Custom Dashboard for Data Visualizations
This project was completed for an industry leading cybersecurity company. Some information has been removed for confidentiality.
——
01 Project Brief
Timeline
7 Months, 2021
Overview
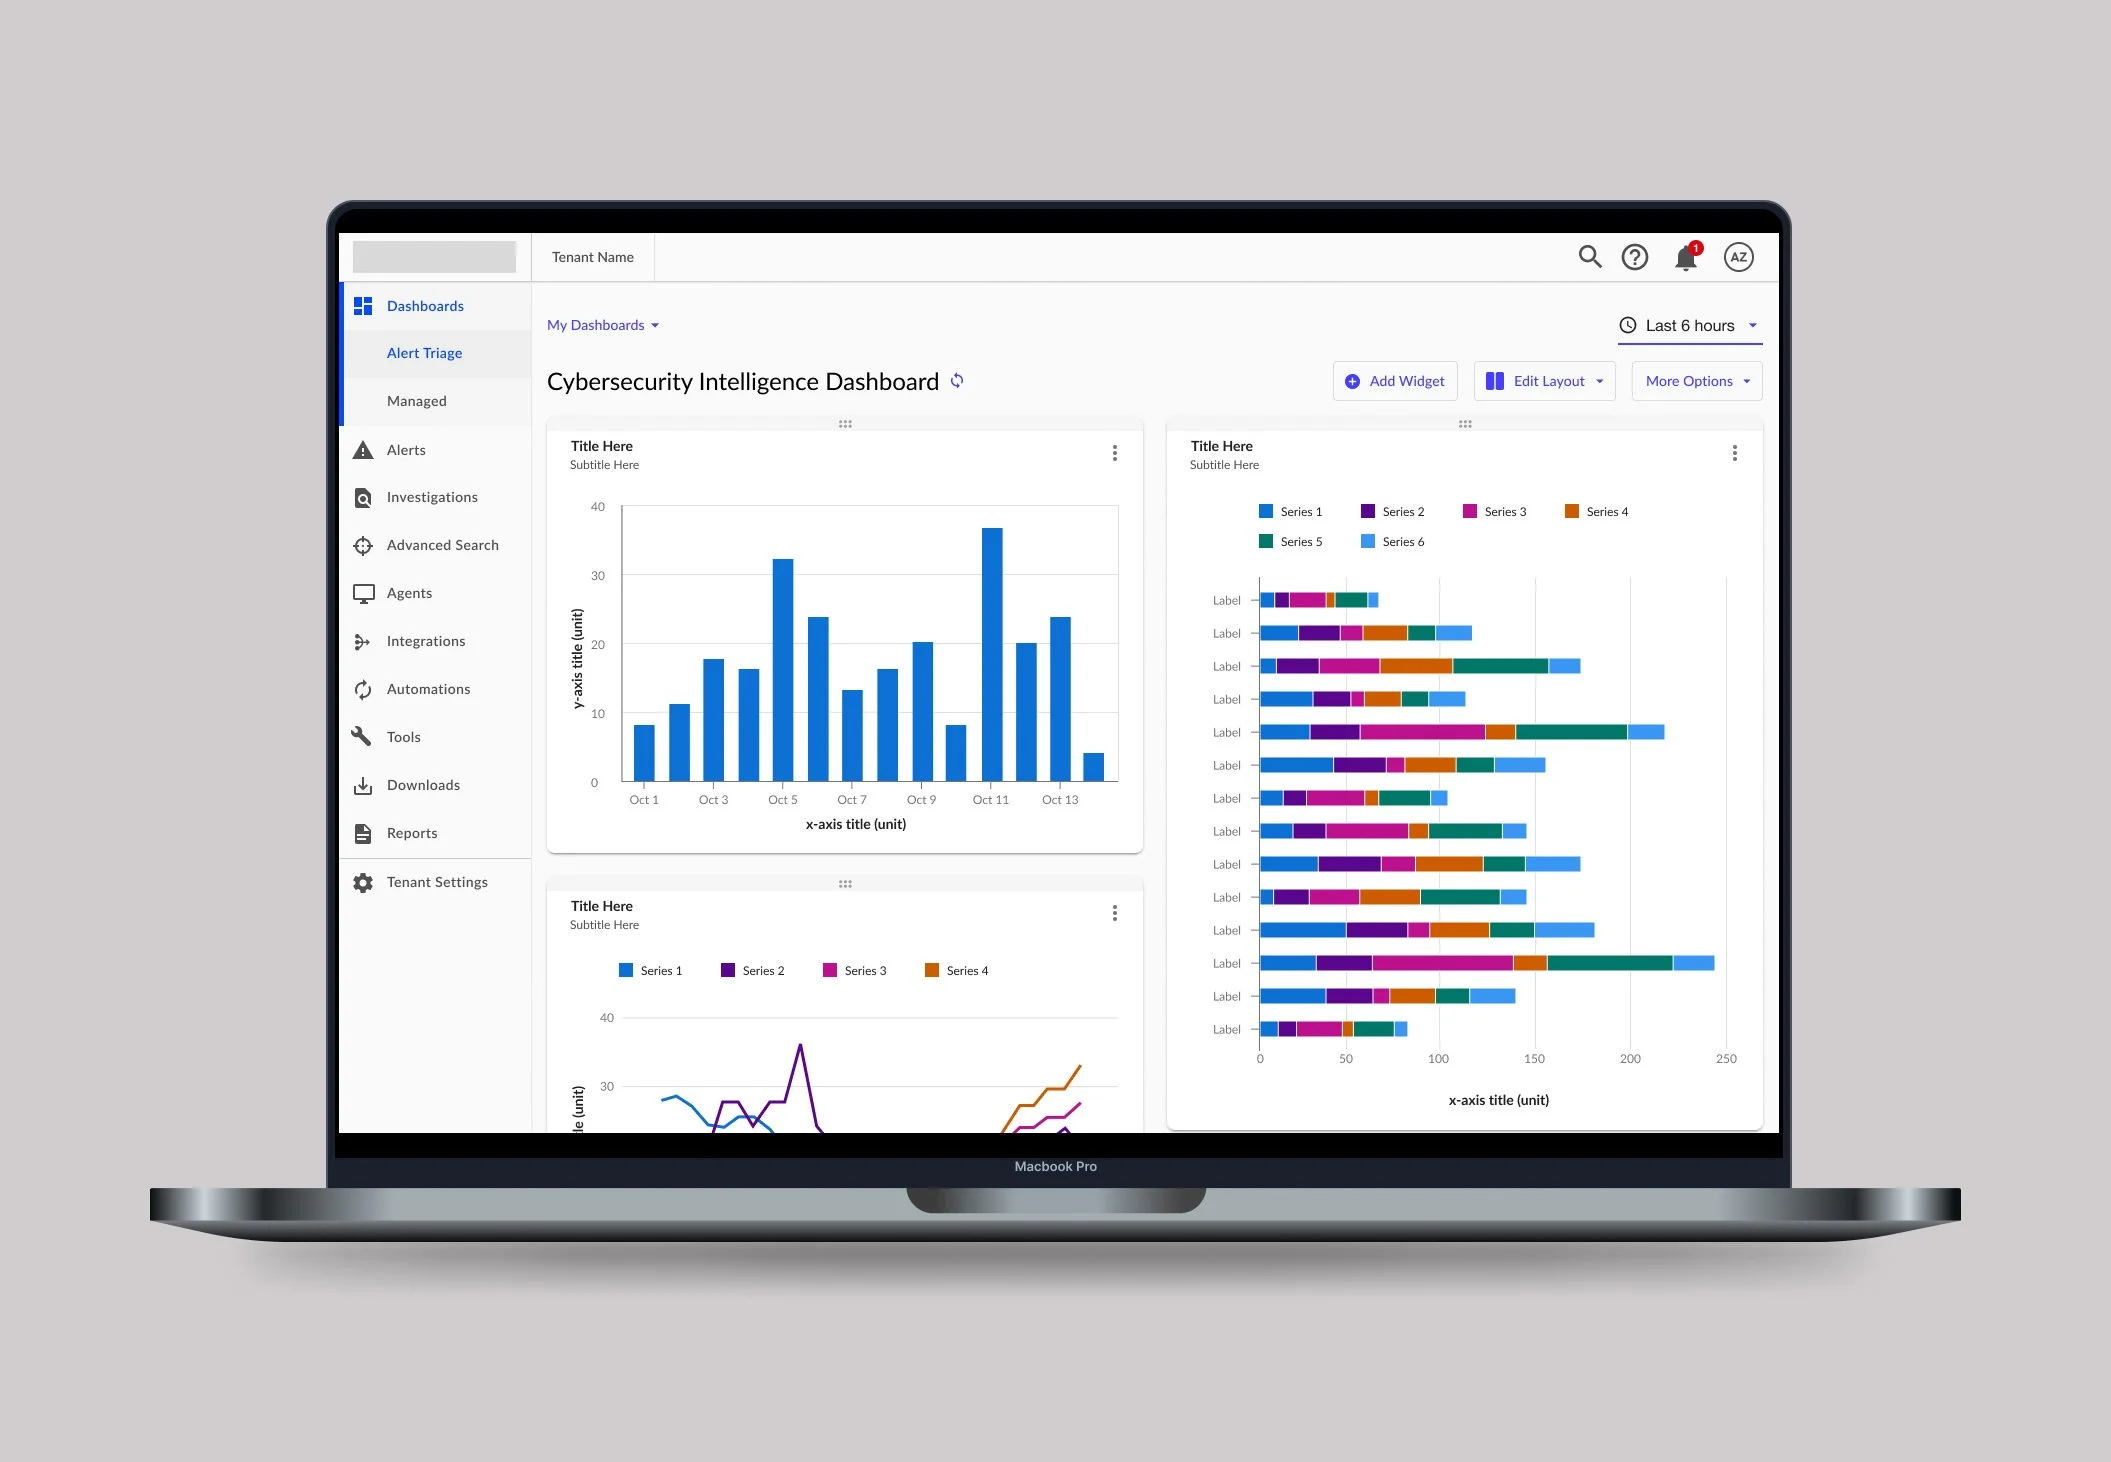
The cybersecurity management platform this feature was created for focuses on reducing security risks. The goal was to create a custom dashboard with data visualizations to quickly detect threats.
Contributors
- 3 UX/UI Designers, Alyse Brown
- Product Owner
- Development & QA Team
My Contribution
- Design Strategy; How do we approach this problem?
- Design Execution; Wireframes, prototypes, high-fidelity designs for development hand-off
- Design System; Created a data viz library with guidelines
02 The Opportunity
02-01
Initial Request
The task was to build a data viz library that could be used across all development teams in the company.
02-02
Revised Request
The priority switched and the team was asked to also create customizable dashboards that catered to the data visualizations.
The Why
The data visuals being used were unclear, resulting in customers exporting data and importing it into other systems. They had to sift through information and export it to outside resources to identify security threats. They needed a way to dig deeper into the data and have it all in one place where they were able to customize views.
The Process
💡 Understand
Empathize
Define
————>
🔍 Explore
Ideate
Prototype
————>
✏️ Create
Test
Implement
— Understand
03 Discovery
Competitive Analysis
Our team wanted to understand what our competitors were doing for dashboards and how we could create an industry leading experience. We looked at five direct competitors and evaluated them on customization, data access, performance, ease of comprehension and structure of information. I also looked at competitors for data visualization and found that IBM had a robust library.
Want
Clean interface with consistent interactions and colors
Clear hierarchy of information for widgets and dashboards
Simple workflows to create and edit dashboards and widgets
Identifying which out of the box insights users want
A way to communicate status of information displayed in the dashboard
Avoid
Overloading users with info that does not meet their needs or provide valuable insights
Confusing or counterintuitive labeling, menu options and flows
Long load times and unresponsive or slow interactions
— Explore
04 Design Iterations
Wireframes
If we wanted to create an industry leading dashboard, then we needed to think big. We created several iterations of wireframes thinking of any way we could to provide value to the customer through customizability. I created wireframes for “Non-Edit Mode” while the other designer on the team looked at an “Edit Mode". Other questions we explored included:
How do you create a dashboard?
How to add, edit and move widgets?
How to edit the layout of the dashboard?
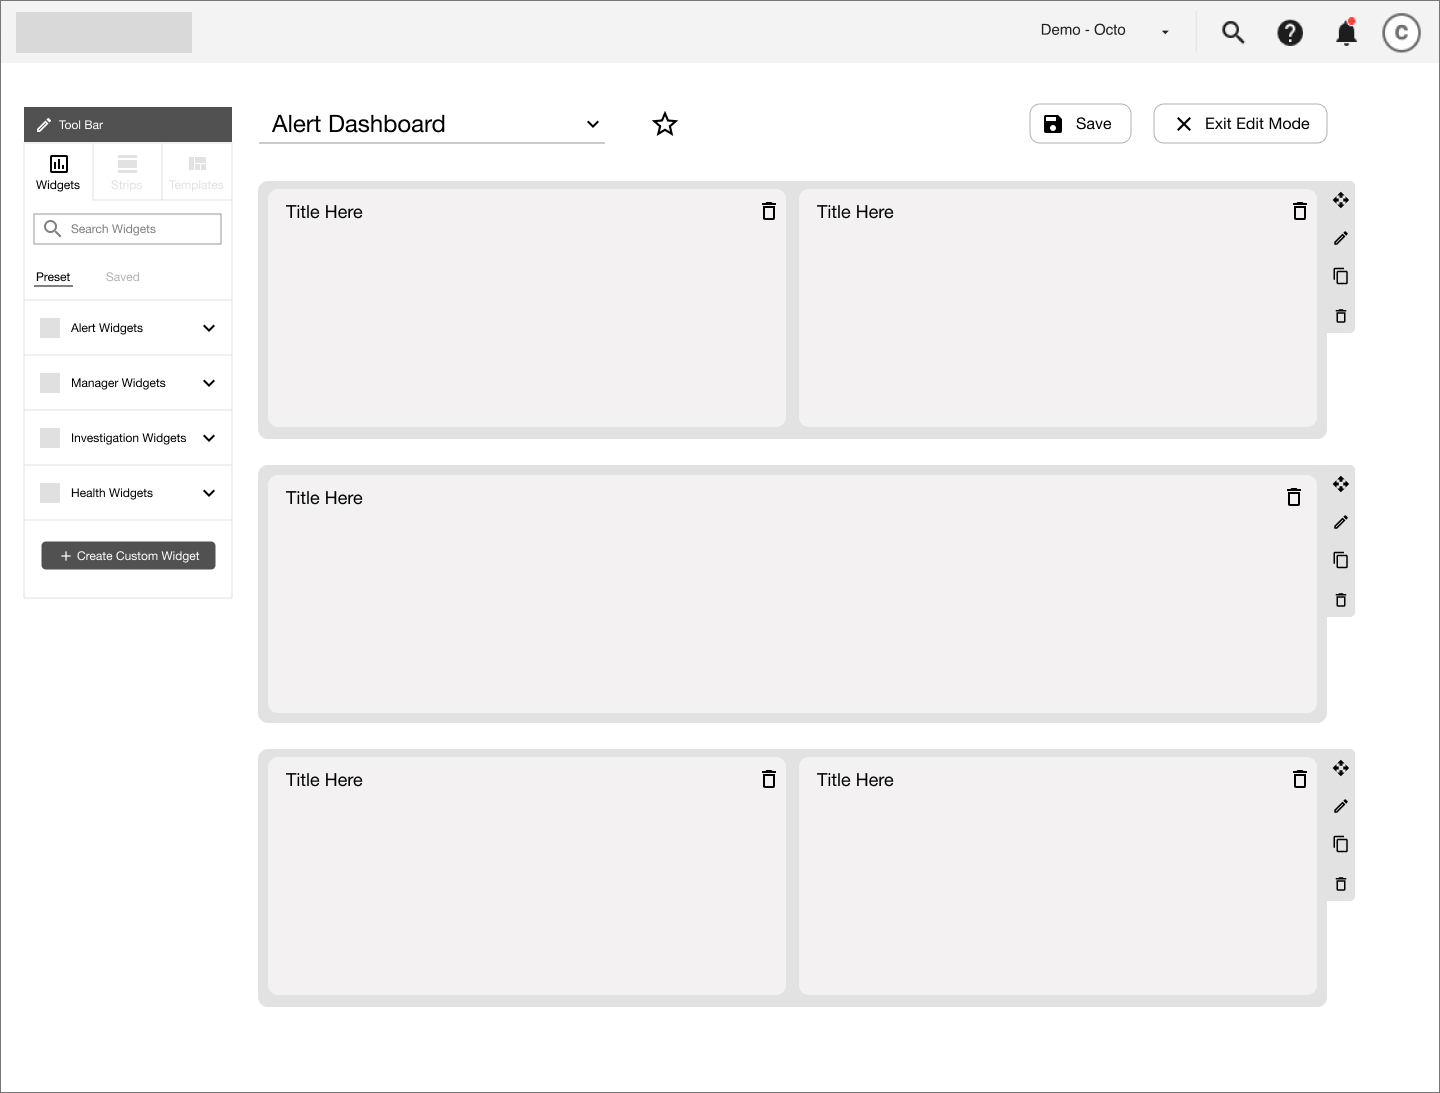
Edit Mode - The entire dashboard is editable. There is a toolbar to help you add and and change elements.
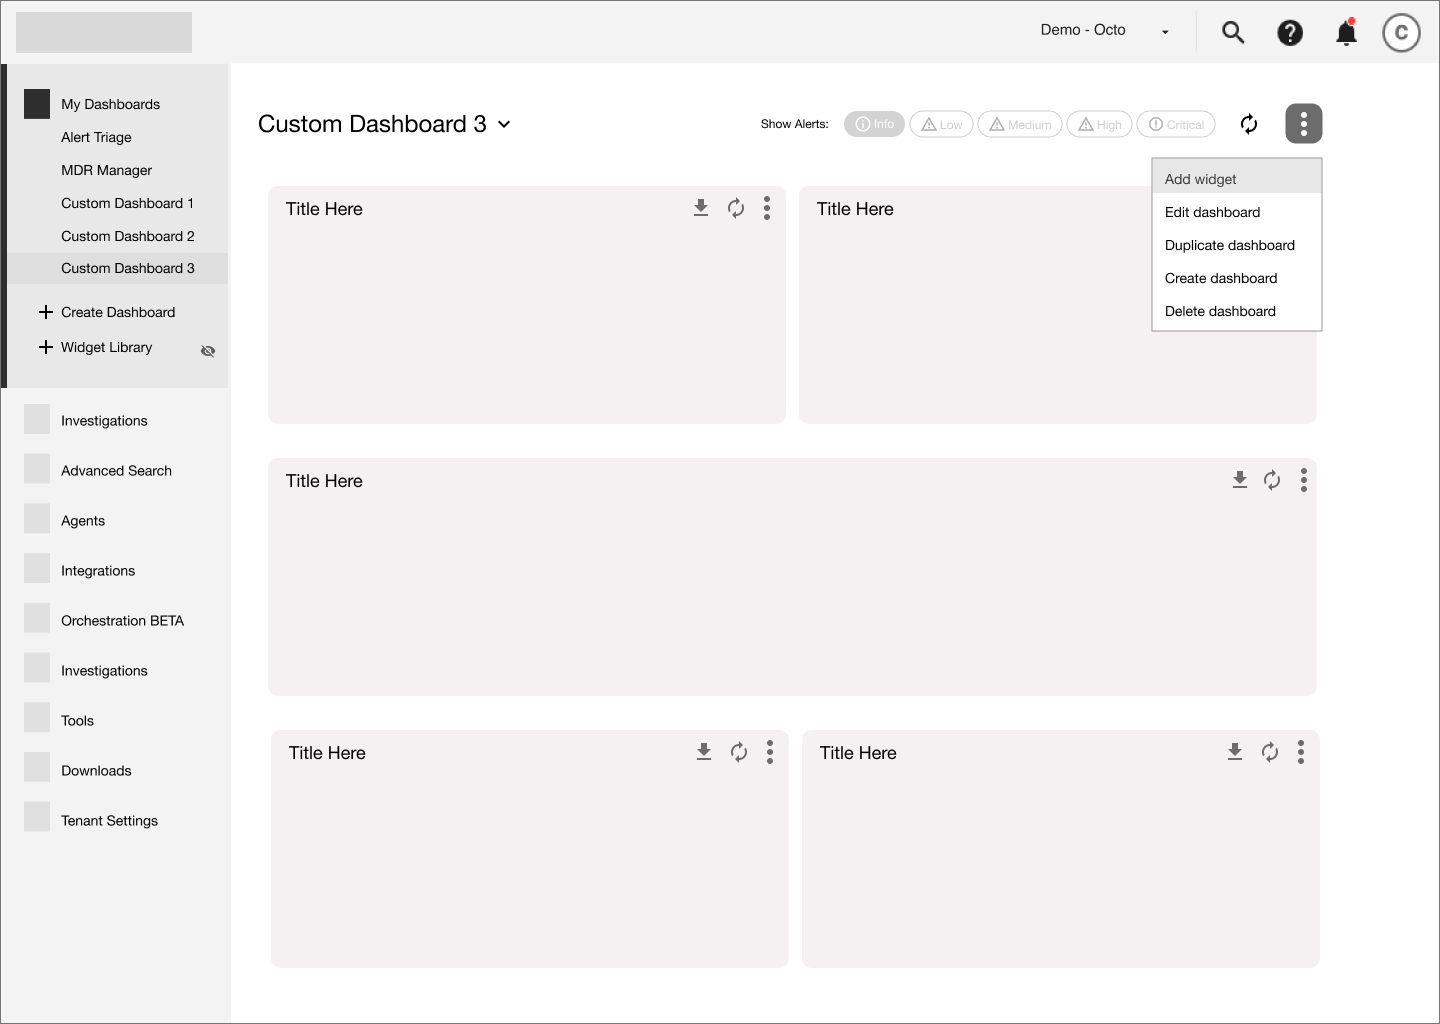
Non-Edit Mode - Editing the dashboard is done through a dropdown. You can add or change one element at a time.
— Explore
05 Key Screens & Functionality
Based on product requirements, we spent several weeks focusing on the interaction of custom dashboards. The most challenging part was determining how the data visualizations (e.g. widgets) worked on the dashboard. Below are some of the highlights:
Dashboard Layout
The development team used flexbox for responsiveness. Rather than adjusting widgets by breakpoints, we provided three layout options that filled the viewport width.
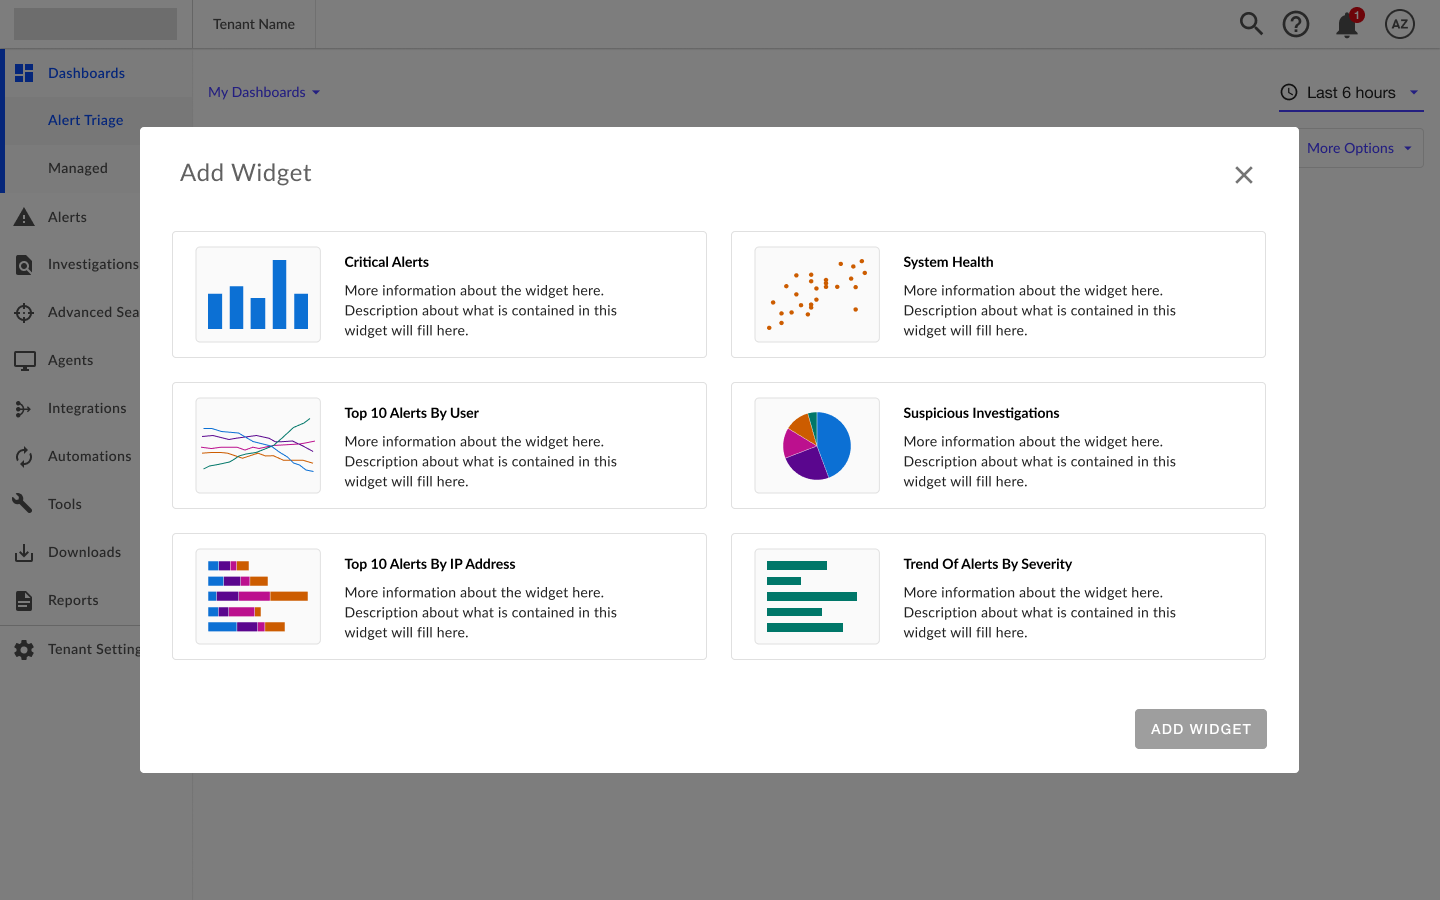
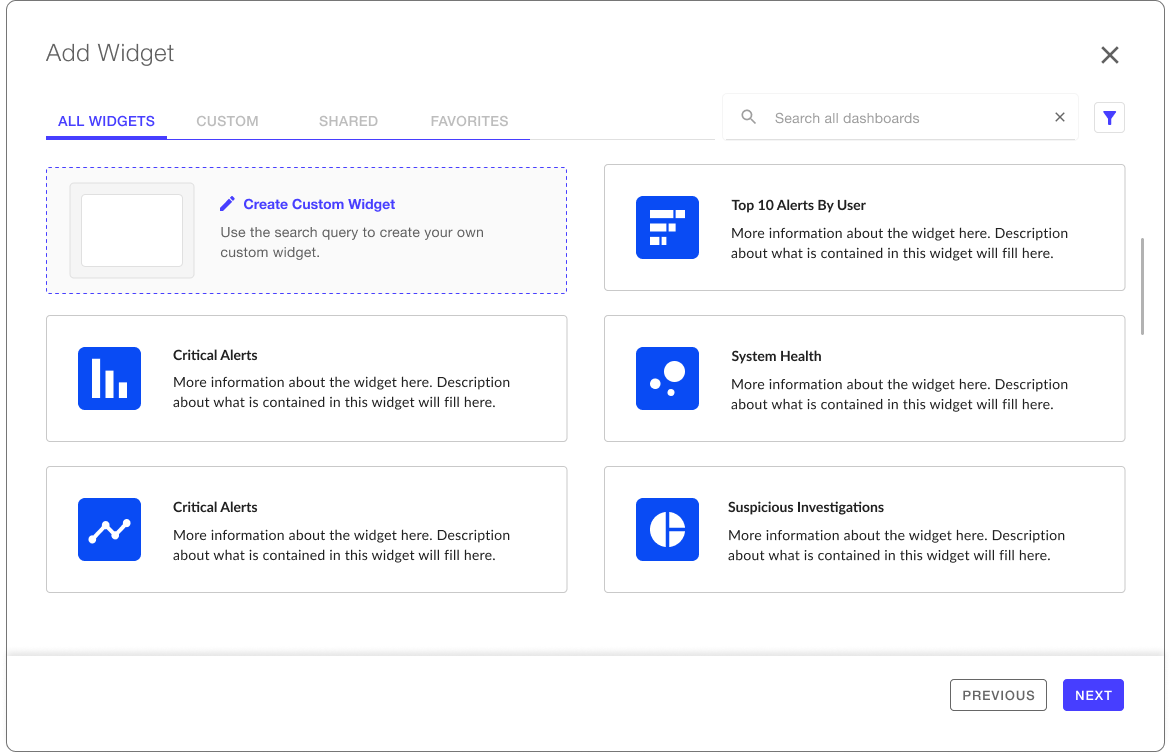
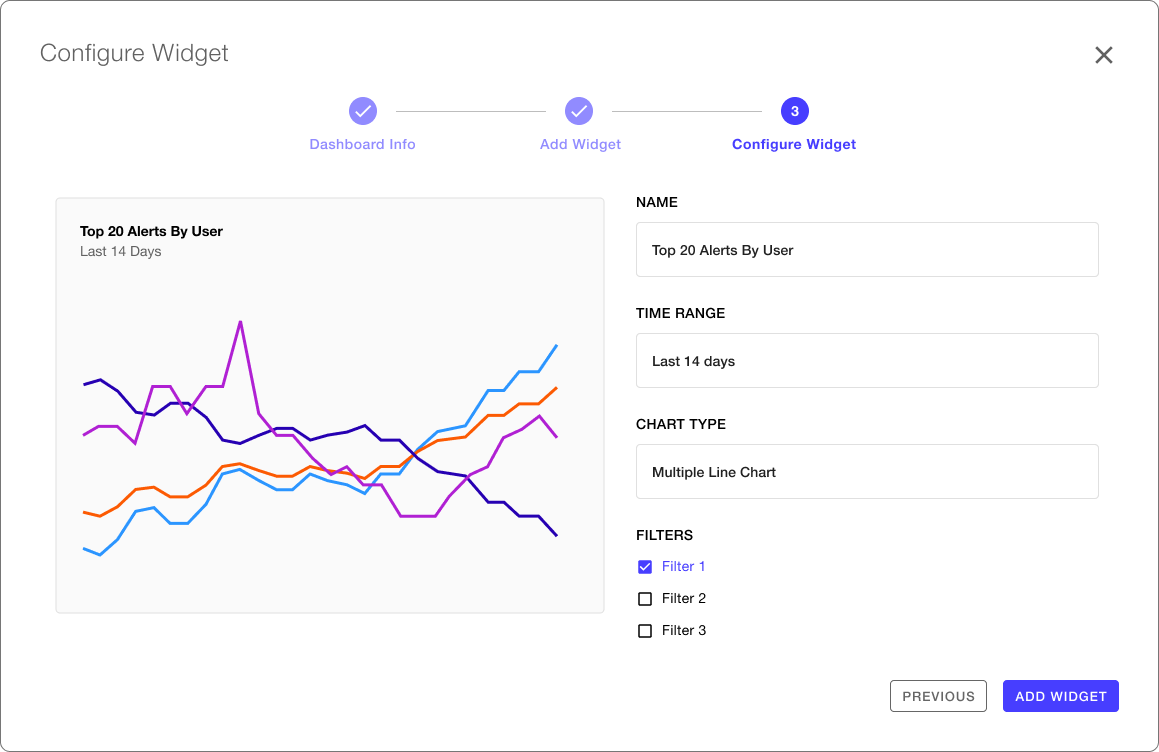
Add a Widget
For MVP, the Add Widget Dialog only included “out-of-the-box" widgets. However, our team did explore how this dialog could expand in future iterations. We provided design flows for creating custom widgets, favoriting widgets, and filtering when the list expands. We also explored simpler images to reduce cognitive load.
MVP
Post MVP
Move a Widget
The team found widget movement to be a challenging discussion. Talking about how the widgets should move on the dashboard created confusion. Therefore, to help provide clarity during these discussions we created low-fidelity wireframes to demonstrate how widgets moved and how they appeared when added. Each widget was clearly labeled with a letter and color to avoid further confusion.
— Explore & Create
06 Data Visualizations
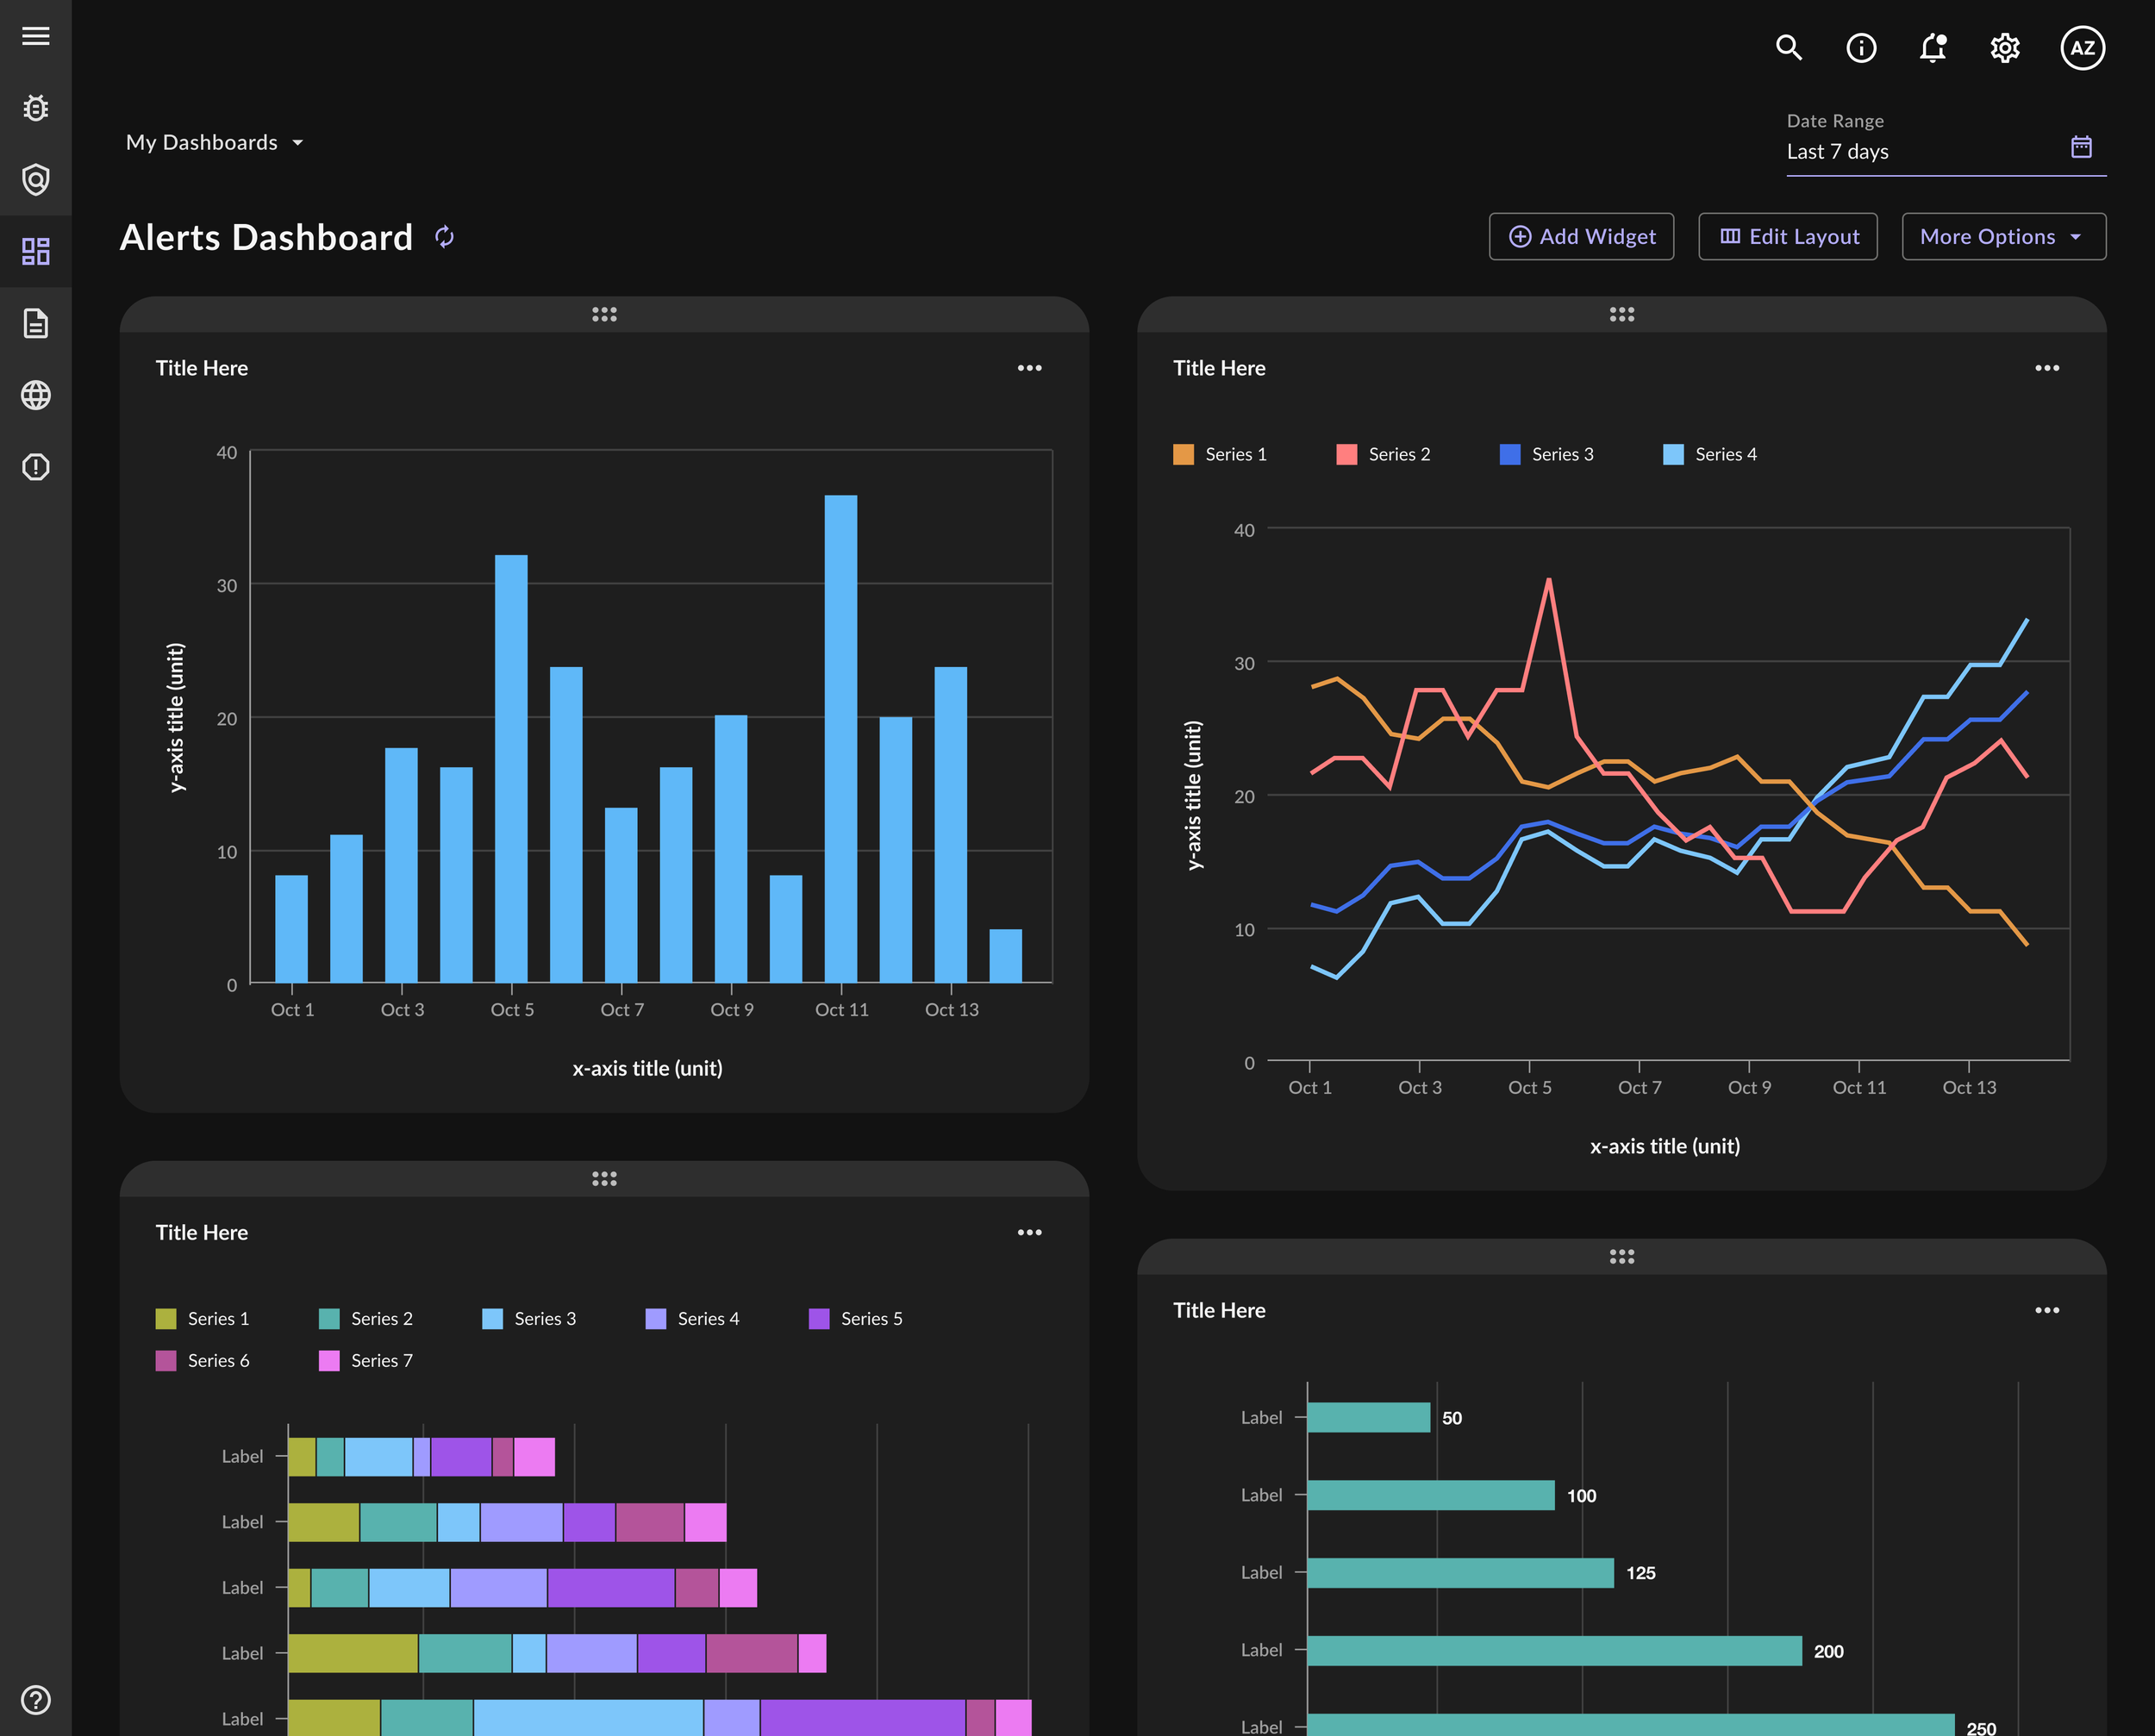
While simultaneously working on the dashboard, I took the initiative to build out a data viz library and supporting documentation. This work included: building 16 different chart types in the Figma library, designing tooltips, hover states, drill down views, determining chart responsiveness, and animation. Dark mode designs were created for the charts as well as for the custom dashboards.
Data Viz Library
Dark Mode
Dashboard
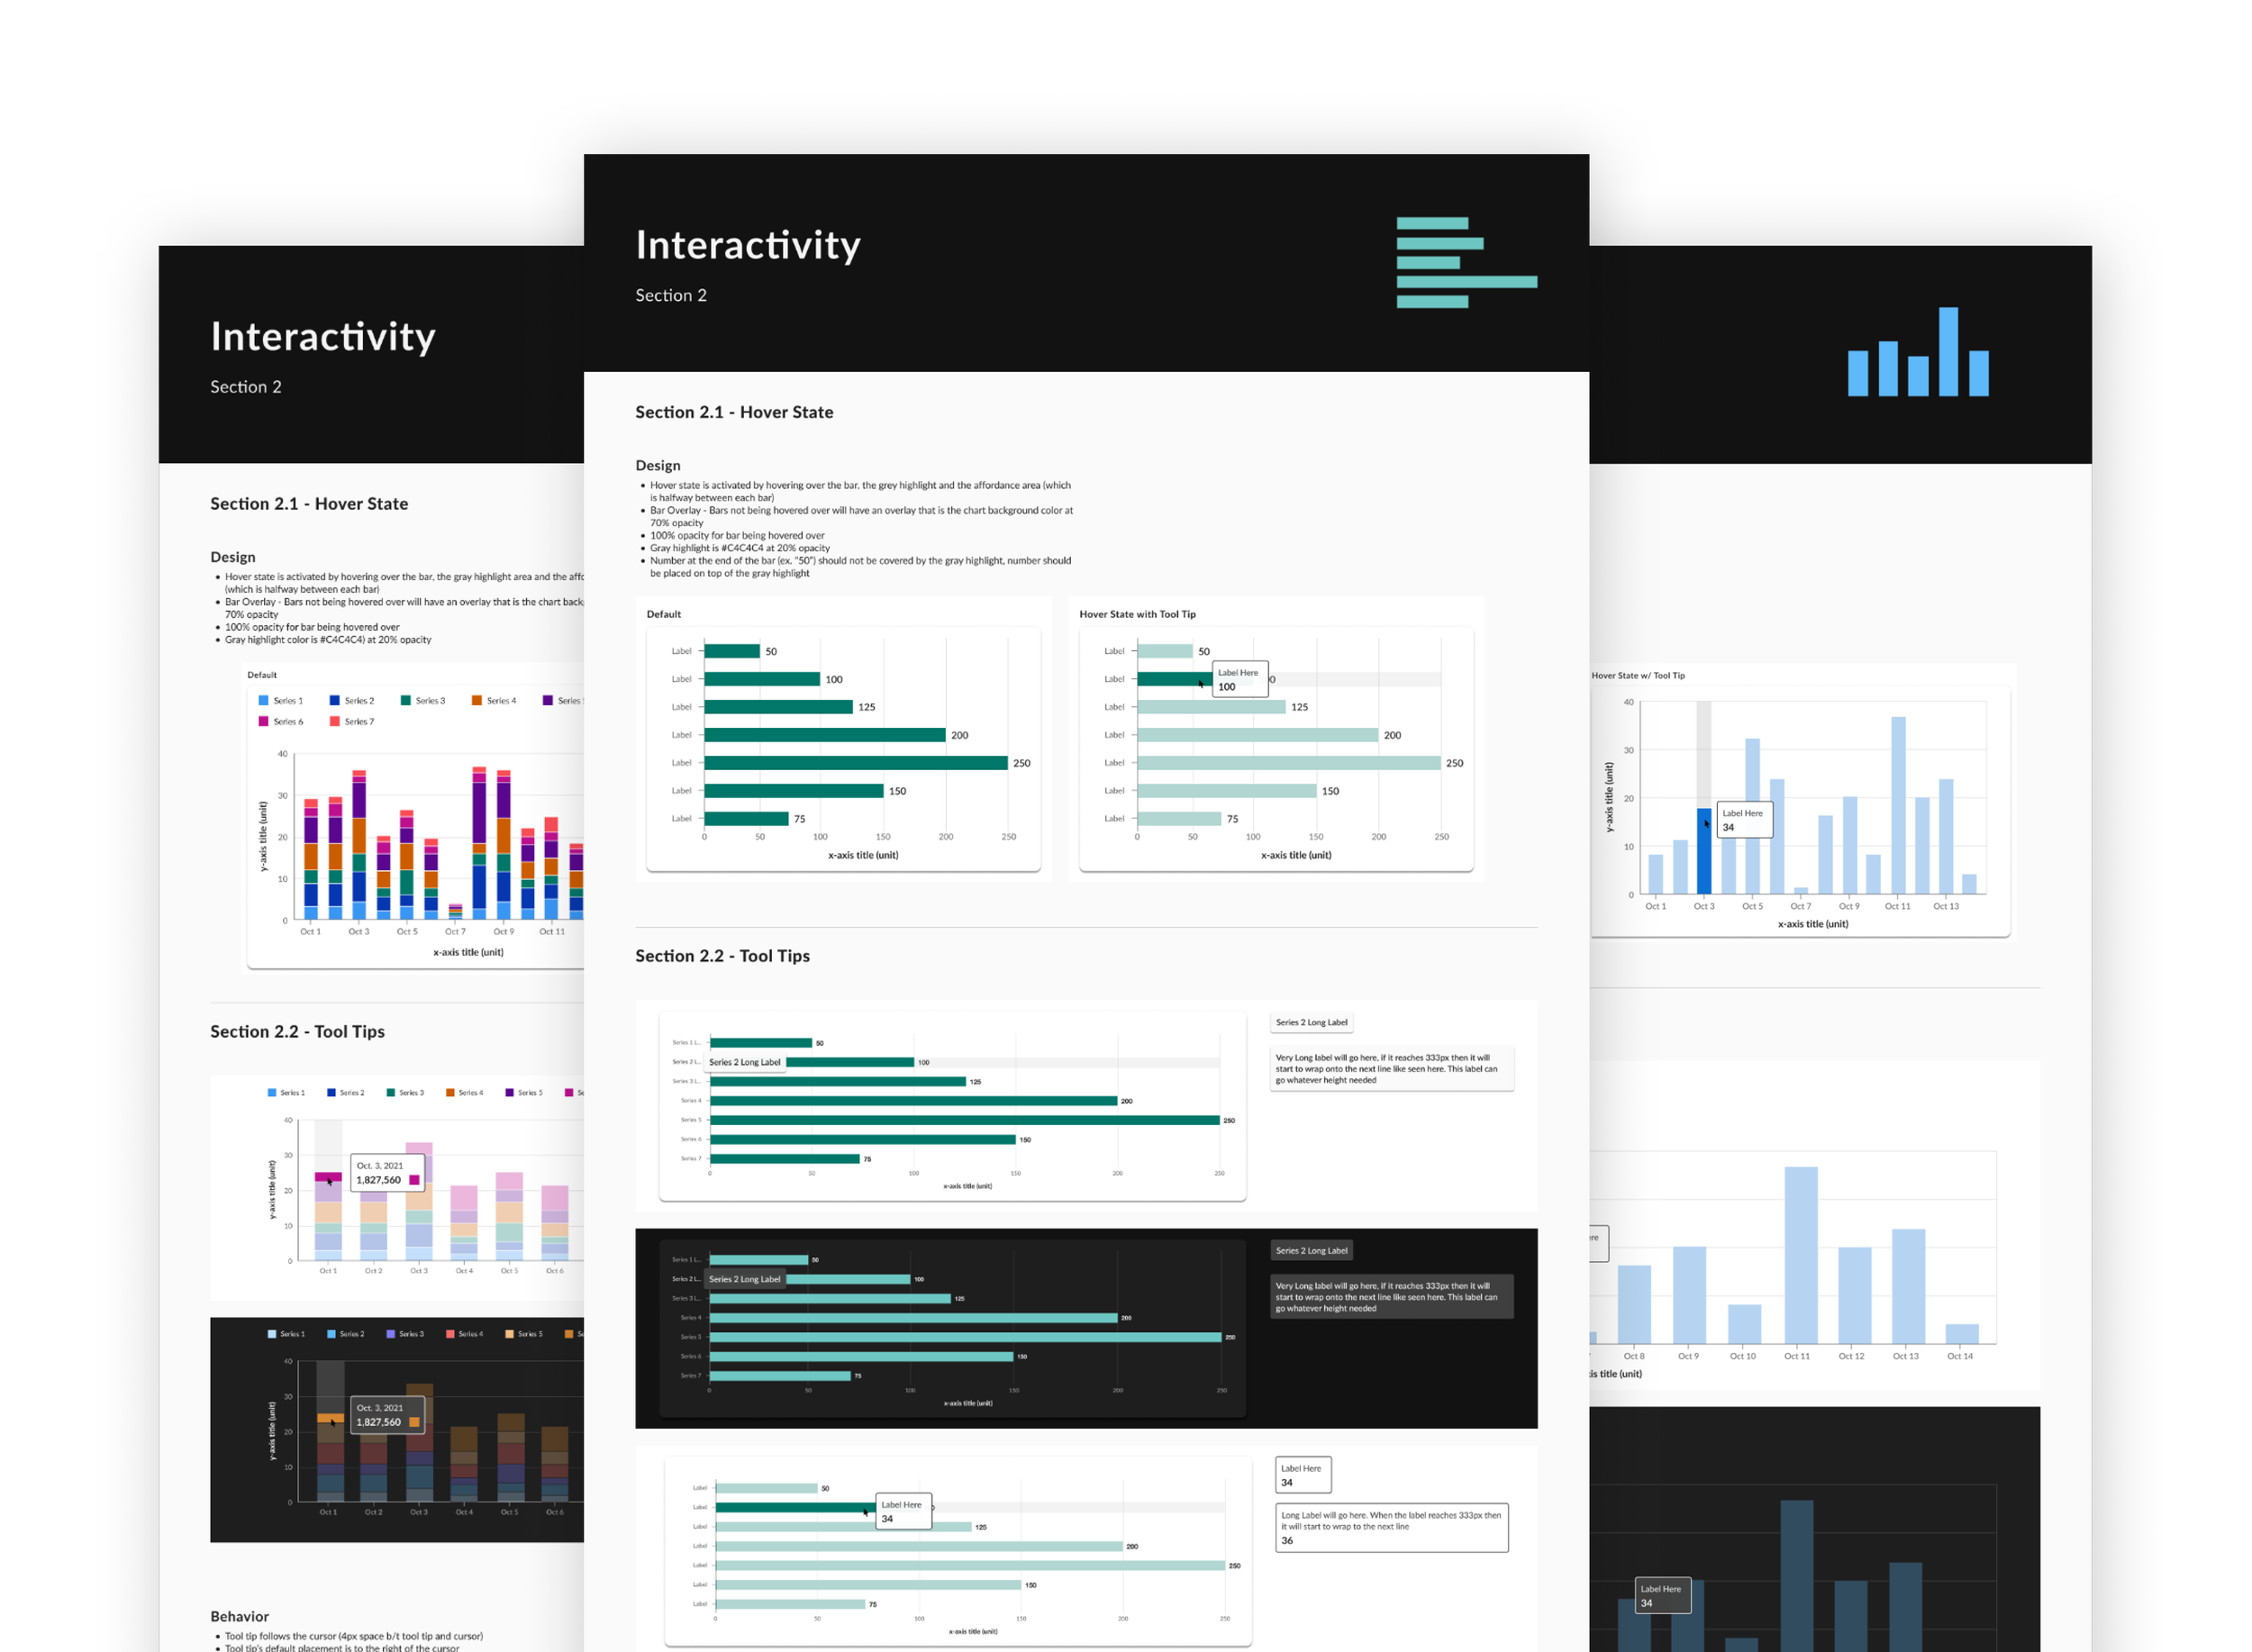
Documentation
I created detailed documentation for each chart that was implemented into the larger design system. Documentation included use cases, best practices, do's and dont's, anatomy, hover states, tooltip usage, legend usage, interactivity, chart responsiveness and more. I also created documentation for PDF versions of the charts since tables and alternative legends were needed to make them accessible in a non-digital format.
— Create
07 Development & QA Testing
Once designs were finalized, they were put into user stories that our team groomed once a week. I worked closely with our development team in refinement sessions to provide clarification on any complexities related to the charts and graphs. After development, QA tested designs and reached out if they found any issues.
08 Results
Within 7 months, the team successfully completed an MVP custom dashboard and data visualization library. With the new experience, users were able to quickly detect cybersecurity threats solving for the original problem that led to this project.
Looking to the future…
It took a while for the custom dashboard work to appear in the product. By the time it was live, the team had rolled off. However, the experience is up and running today and a valuable part of the cybersecurity company’s offerings. We also handed-off post MVP flows where we explored what the future of custom dashboards could look like and included smaller updates the company could make as well.